

Projecting Costs: BTN Corporate Travel Index
(March 2022)
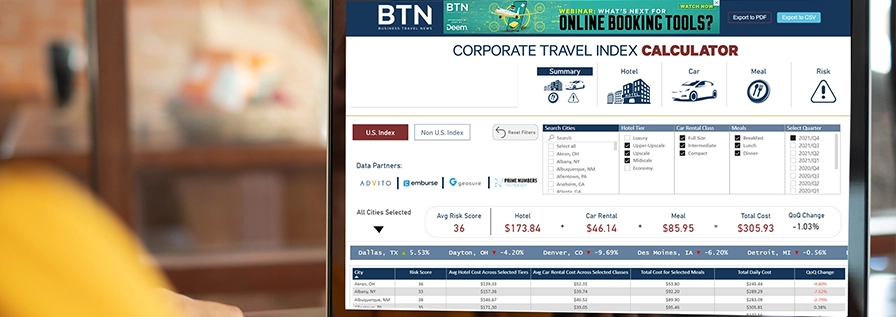
Projecting costs and managing budgets in post-pandemic periods is challenging. However, with the analysis from the BTN (Business Travel News) Corporate Travel Index , much of the guess work can be reduced by understanding the shifts related to the average daily costs of travel for hotel and ground transportation. Whether you look at the costs being on the rise as a good barometer of the health of renewed business travel, or choose to view the costs rising faster than the corporate travel recovery, the fact is that it is time to review your top cities and prepare for the outcome. For your convenience, we have provided a link to the Corporate Travel Index Calculator , which allows you to search by city, hotel tier, car rental class and meals for the United States as well as non U.S. major cities.
Key Points for your Attention
Covid-19 and its related variants will not exit the corporate travel stage in 2022. The most recent Omicron variant BA.2 is just another example that the way forward will not be like the way before it. Disruption will occur and service levels will continue to be volatile as a result of the industry responding beyond predictions and estimates.
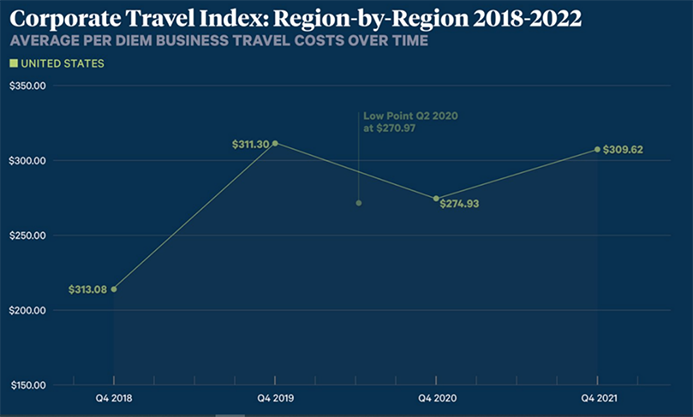
Image Source: BTN
With pent up demand for travel, hoteliers are seeing unique trends including:
- Outside Major Gateway Cities: Many travelers are exploring business outside the larger gateway cities. Secondary cities like Cleveland and Columbus Ohio, Indianapolis, Louisville, KY and Tulsa Oklahoma have each seen double digit hotel rate percentage increases.
- Primary cities are strongly divided : Cities including New York, Chicago, Philadelphia, Seattle and Washington DC are lagging 2019 price points, averaging rates from 7-10% lower than 2019 levels. Contrary to these markets, hotels in Miami are up 23%, Los Angeles nearly 16% and Dallas up more than 6%.
- Cities known for dot-coms : Cities such as San Francisco which is averaging a 35% decline of 2019 rates, is largely thought to be due to most companies have not returned to the office, and related demand for properties for visiting partnerships are remaining virtual for the time being.
Ground Transportation
- Slight drop in top 100 cities : Although much has been said about car availability at airport rental car locations, the rate of the rental has stabilized, dropping slightly from the escalated 2020-2021 period.
- Stand firm with negotiations: The rental car markets are competitive and your preferred supplier does not want to lose your business. Review both your TMC and Expense data to identify your total spend for rental car, review with the corporate travel index and then hold firm with your requirements.
Leave a Reply
Leave a reply cancel reply.
Your email address will not be published. Required fields are marked *
Save my name, email, and website in this browser for the next time I comment.
Looking to Build or Enhance Your Travel Program?
Our location, quick links.
- Business Travel
- Government Services
- Privacy Policy
Recent Posts
- How would a ban on TikTok impact Business Travel?
- TMCs Using AI To Target ‘Low-Hanging Fruit:’ Inbound Email Automation
- Duty of Care for Domestic Business Travel
Newsletter Signup

This site uses cookies to provide you with the best digital experience while using the website. By clicking agree, you consent to the use of this website and cookies per the privacy policy .
Cookie and Privacy Settings
We may request cookies to be set on your device. We use cookies to let us know when you visit our websites, how you interact with us, to enrich your user experience, and to customize your relationship with our website.
Click on the different category headings to find out more. You can also change some of your preferences. Note that blocking some types of cookies may impact your experience on our websites and the services we are able to offer.
These cookies are strictly necessary to provide you with services available through our website and to use some of its features.
Because these cookies are strictly necessary to deliver the website, refusing them will have impact how our site functions. You always can block or delete cookies by changing your browser settings and force blocking all cookies on this website. But this will always prompt you to accept/refuse cookies when revisiting our site.
We fully respect if you want to refuse cookies but to avoid asking you again and again kindly allow us to store a cookie for that. You are free to opt out any time or opt in for other cookies to get a better experience. If you refuse cookies we will remove all set cookies in our domain.
We provide you with a list of stored cookies on your computer in our domain so you can check what we stored. Due to security reasons we are not able to show or modify cookies from other domains. You can check these in your browser security settings.
We also use different external services like Google Webfonts, Google Maps, and external Video providers. Since these providers may collect personal data like your IP address we allow you to block them here. Please be aware that this might heavily reduce the functionality and appearance of our site. Changes will take effect once you reload the page.
Google Webfont Settings:
Google Map Settings:
Google reCaptcha Settings:
Vimeo and Youtube video embeds:

BTN’s 2024 Corporate Travel Index
BTN’s 2024 Corporate Travel Index is the business travel industry’s definitive resource for business travel costs in 200 cities around the world. Use it to benchmark your current program or to offer insights into rate trends in the markets you care about most. The index is unique in that it tracks actual corporate booked hotel and car rental rates using data from managed travel sources, not consumer data, to reflect actual managed travel activity as opposed to theoretically available rates.
Hotel, car rental and safety data are updated quarterly in BTN’s Corporate Travel Index Calculator , where users can customize per diem snapshots based on the class of service allowed by their travel policies for hotel and car rental categories. Meal costs and taxi rates are updated annually. Five years of data are now available in the calculator, allowing for year-over-year or quarter-over-quarter comparisons.
Most Recent Quarterly Data Tables
BTN offers its most recent quarterly Corporate Travel Index data in summary documents available for download . These tables include all 200 cities and are calculated using data for all classes of service, including economy, midscale, upscale, upper upscale and luxury for hotel rates and compact, midsize and full-size rental car rates.


- Product updates
- Business Travel Insights

Corporate Travel Index 2022: Insights and Benefits
BTN (Business Travel News) annually ranks business travel cities using various criteria. BTN’s corporate travel index is calculated based on the following factors: average room rate, car rental/taxi rates, restaurant meal prices, and risk level. In 2022, BTN introduced a new ranking that includes an analysis of daily business travel expenses in 200+ cities around the world. The study covered North America, Europe, Asia-Pacific and Latin America.
The recovery of business travels and offline meetings is happening faster than had expected
As prices rise, many companies and travel managers will also face the effects of pent-up demand for business travel. Despite earlier forecasts that business travel would be the last in line for a recovery, we see a slightly different picture today. Employees who went on regular business trips before the pandemic struck are gradually resuming their usual business lifestyle. They are now eager to return to in-person meetings with clients and colleagues as soon as possible.
At a time when hybrid and remote meetings have become commonplace, companies and organizations are trying to quickly restore the previous level of working relationships, teamwork and corporate culture, as well as increase the level of trust between colleagues. The first half of the year already witnessed a surge in face-to-face meetings between company employees.
According to a survey of remote workers by Oxford Economics, 38% of respondents said that employers were now more often encouraging face-to-face meetings. Also, 32% responded that their employer would like corporate training to be held offline, 29% received incentives for attending holiday parties in the company, and 20% for having a face-to-face meeting with their supervisor.

The recovery of business travels and offline meetings is happening faster than had expected. Photo: Briana Tozour / Unsplash
Travel managers are seeing a recovery in business tourism and are trying to adapt to new trends by adopting various strategies that would help reach a compromise between increased demand for offline meetings and budget constraints. These strategies may include various mechanisms that enable companies to be prepared for unscheduled cancellations, rescheduling of business trips, and refunding of unused flight tickets.
As part of budgetary control, managers are encouraged to find a balance between two metrics – number of trips planned and cost of each business trip. For example, you can reduce the total number of business trips while doubling the cost per trip. Or you can find the right combination of these two metrics to stay within the company’s budget. Real-time price monitoring or analysis of collected data on previous trips can also help avoid overspending. Some managers may also employ corporate traveler incentive tactics. The method aims to encourage employees to save more corporate funds on business trips. This approach would reduce the company’s overall cost, but not severely cut back on sending employees on business trips.
Expense report as an effective tool for cost estimation
Expense report helps you to effectively manage and control all your travel expenses using filters and then examine the analysis. It’s already available on Roundtrip. Go to Reporting → Online Account → Expense report.
Europe and North America
Coronavirus outbreaks remain a key factor affecting business travel recovery this year. New hotbeds of the virus have been regularly reported in Europe, which was the pre-pandemic leading destination for business travelers. However, it is not yet clear how the new waves of the disease in Europe would affect the structure and volume of business travel. Since pandemic fatigue is seeping in across Europe, a lockdown is an unlikely option. European authorities are more likely to focus on vaccination and hospitalization rates rather than the number of new cases. So far, the UK, Germany, France and Italy have lifted most of their COVID-related entry restrictions.
The U.S. still requires proof of being fully vaccinated or a negative PCR test for all international travelers. At the local level, however, many restrictions have been lifted. For example, most states no longer require masks to be worn in public places.
Domestic business travel in the U.S. is also passing through difficult times. Despite expected business travel market recovery in 2022 and increased demand for air travel in the first two quarters, employers are cutting back on business travel spending. For example, U.S. companies cut their business travel budgets by 25% this July compared to the same month last year.

Domestic business travel in the U.S. is also passing through difficult times. Photo: ben o’bro / Unsplash
Asia-Pacific
The Asia-Pacific region is also easing pandemic-related travel restrictions. Australia, which, for nearly 100 weeks, had some of the strictest covid restrictions in the world, lifted most of these restrictions for international travelers in the first quarter of this year. New Zealand opened its borders to tourists in August and has now lifted all covid restrictions; vaccination certificates and PCR test results are no longer required for entry. South Korea lifted its quarantine requirements for incoming international tourists in March. Japan, which closed its borders to travelers during the new Omicron variant of COVID-19, is reopening to student and short-term business travel. As of October 11, the country is lifting almost all restrictions on arrivals. Thailand also stopped requiring PCR tests from all tourists starting on October 1.
Despite the general tone of positive news in the region, the risks of new waves of the coronavirus remain high. At the end of summer and early fall, many countries in the region experienced a sharp rise in the number of cases. For example, China, which continues to adhere to a “zero-tolerance” COVID-19 policy (even for isolated cases, Chinese authorities can impose a lockdown on entire counties and quickly carry out mass testing), had to send 37 million people to lockdown across the country, including Beijing, Shanghai and Shenzhen. South Korea also experienced another spike in infection rates in late summer.

South Korea lifted its quarantine requirements for incoming international tourists in March. Photo: Markus Winkler / Unsplash
Latin America
In Latin America, business travel market recovery is primarily driven by domestic travel. However, since Q2 2022, after yet another wave of cases had faded, international business travel within the region gradually began to return. The study predicts that this year will see a demand for international business travel within the region reaching 70% of pre-pandemic levels. The recovery trend of the business travel market is also influenced by international tourism. As the demand for air travel increases, so does the price of hotel services. Both factors will inevitably but positively affect the business travel industry.

In Latin America, business travel market recovery is primarily driven by domestic travel. Photo: Social Income / Unsplash
According to BTN analysts, demand for global business travel will continue to increase at least until the end of 2022. Meanwhile, the hotel industry’s recovery has acquired an atypical nature – room rates are the main driver of the recovery, rather than occupancy rates. In almost all regions of the world, room rates have reached pre-pandemic levels, and have even exceeded it in many cities in almost all regions of the world.
Book on Roundtrip

Traveller Tags
- Corporate Sales Manager
- Job offer Worldwide
- Corporate Account Manager
- Job offer in the Baltics
- Job offer CIS
- Corporate Launcher Sales Manager
- referral program
Follow us for the latest news

- Avia tickets
- Group requests
- Help Center
2024 Cherry Blossom Forecast (11th forecast) More Details Here .
KIE’s Commitment to SDGs. More details Here .
The United States and Japan officially launched the “U.S.-Japan Tourism Year” in 2024. More details Here
You can get your KIE’s invoice anytime when you need it. How to ?
< Important > International Travel Notification Here. Travel State Gov – U.S. DEPARTMENT of STATE .

Kintetsu International

- Automated Systems
Work Efficiency
Cost reduction, risk management, enhancement of governance.
- Online Booking
- KIE Preferred Hotel
- Group Travel to Japan
- Incentive Travel
- Business Meeting
KIE Preferred Hotel Program
- About a Program
- Nationwide Discount Hotels
- Hotel Promotion
- Search Hotels nearby
USA/ Northeast
- New Jersey/ Philadelphia
- Boston/ Providence/ Manchester
USA/ Midwest
- Wisconsion/ Iowa/ Kansas/ Missouri
- Ohio/ Indiana
- Washington DC/ Virginia/ West Virginia
- Kentucky/ North Carolina/ South Carolina
- Georgia/ Florida
- Tennessee/ Alabama/ Louisiana/ Oklahoma
- Houston/ Dallas/ Austin/ San Antonio
- Portland/ Seattle
- Los Angeles/ Orange County
- San Francisco/ San Jose
- Las Vegas/ Phoenix
International
- Puerto Rico
- Hotel Booking in Japan
- Case Study/Testimonials
- Branch Information
- How to print your Invoice
- View Your Trip
- Flight Status
- Visa Arrangement
- Wi-Fi Rental
- Travel Insurance
Business Travel News / Corporate Travel Index Calculator
Last Updated : 03/27/2024

Corporate Travel Index Calculator
Provided by Business Travel News
Hotel, car rental and safety data are updated quarterly in BTN’s Corporate Travel Index Calculator , where users can customize per diem snapshots based on the class of service allowed by their travel policies for hotel and car rental categories.
Meal costs and taxi rates are updated annually. Five years of data are now available in the calculator, allowing for year-over-year or quarter-over-quarter comparisons.
– This tool is updated every quarter and serves as your free, customizable rate reference for year-round data.
Choose your target cities, hotel service tiers, car rental tiers and meal selections to understand likely business travel costs for your program.
Calculator “US and NON US” Index Here
Calculator “Europe ” Index Here
Find by Keyword
- Frequent-flyer programs
Popular Resources

Business Travel News / Business Travel Per Diems for 200 Global Cities
According Business Travel News BTN’s 2024 Corporate Travel Index...
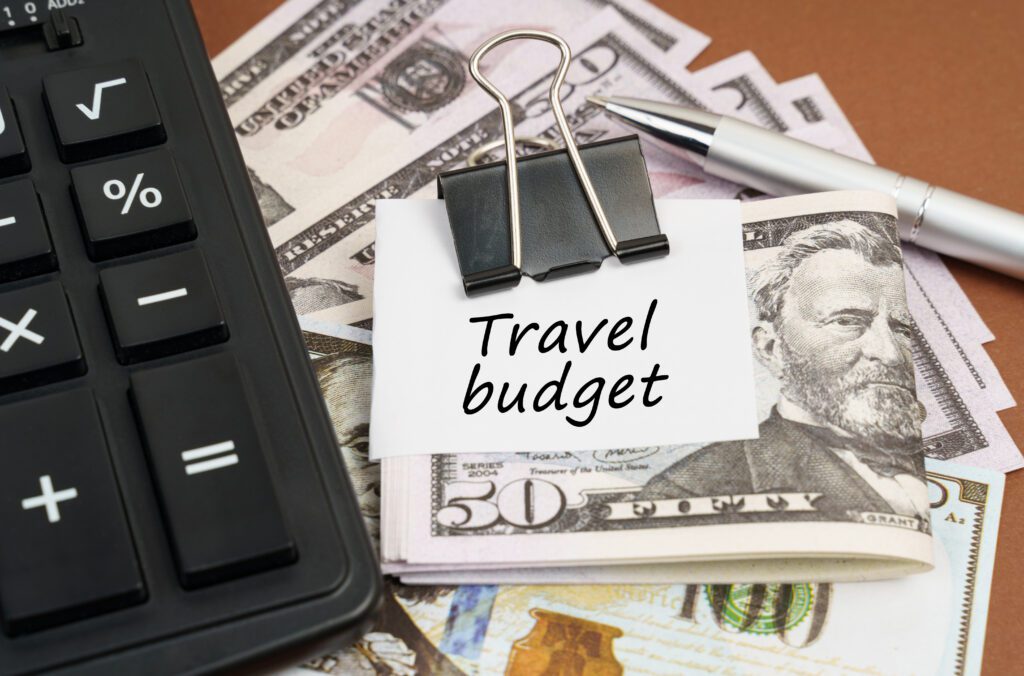
Provided by Business Travel News Hotel, car rental and...
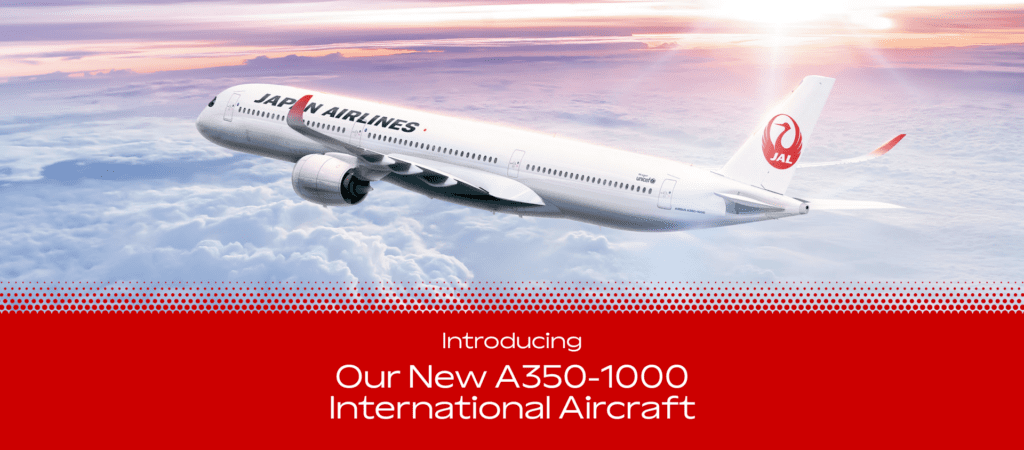
JAL’s latest aircraft: Haneda to Dallas/Fort Worth route begins operation
JAL's new aircraft to begin service on Haneda-JFK route
Related Resource
- AirlineBTMCorporateMICE
According Business Travel News BTN’s 2024 Corporate Travel Index is the business travel industry’s...

2024 Cherry Blossom Forecast (11th forecast)
According to the Japan Meteorological Corporation’s News on 4th April 2024

- AirlineBTMCorporateMICETravel requirements海外渡航
New Entry Requirements to Japan after 25th JAN 2024 at 3:00 AM (Japan time)
For those entering or returning to Japan after 25th Jan 2024 3:00 AM (Japan Time), ...
Business Travel Management
Adapting to changing business travel.
What kind of procedures do you and your employees follow when making reservations for airline tickets and hotels for business trips?
After experiencing the unprecedented pandemic caused by the new coronavirus, there is an increased focus on risk management. We propose “risk management” solutions for the purpose of the safety and health of business travelers.
More urgent business trip, more cost than necessary! According to our analysis, the largest expense within the total corporate travel costs is the airfare, accounting for nearly half. Additionally, affordable flight tickets and hotels may not always represent the optimal conditions.
In today’s business environment, it is common for companies to spread out all over the world and conduct global business activities. Among them, Business Travel Management (BTM) focuses on the proper planning and management of frequent and business-related travel by corporate employees and executives.
This link will redirect you to the website of Kinki Nippon Tourist Corporate Business Co, Ltd. All inquiries will be answered by KNT Corporate Business Co. Contact here .
BTN’s Corporate Travel Index NEW UPDATES
All new meal cost data for 2023; the latest quarterly updates.
Text-only version of this email
The latest emails sent by business travel news.
Gatwick adds routes to Asia | Travel Counsellors launches first OBT
SAS to Switch Airline Alliances
Global air demand stays strong | UK Border Force strike called off
Eulogy for EDIFACT? Airline, Tech Execs Debate at UATP Conference
Boeing Pays Alaska Airlines $160M for Max Grounding
BTN's Car Rental & Ground Survey; TMC M&A; JetBlue's Bag Fees and Service Changes
More emails, deals & coupons from business travel news.
Accelya Enables NDC Exchange for American Airlines EDIFACT Tickets
Concur to Debut Overhauled Booking Tool in Q4; Tripbam to Introduce Airfare Analysis by Content Source
Travelport to offer United and BA NDC content | Salaries in business travel continue to rise
Traveler Experience Index: Bleisure Opportunity?
Emburse acquires Tripbam | New rail link between Paris and Brussels
GBP 50 Amazon voucher for meeting with our travel solution experts
Finalists announced for Business Travel Awards Europe 2023 | Airline associations push governments on slot regulation
Watch the Business Travel Innovation Faceoff Europe in full
Travel program less than $25M annually? BTN needs to hear from you.
Smaller Spenders, Bigger Deal: BTN’s Small & Midsize Travel Program Report
School’s in Session – Check Out Our Spotlight Courses
Independent TMCs ‘outperforming’ market | Winners of Business Travel Sustainability Awards Europe
Email offers, discounts & promos from our top stores.
SALE EXTENDED - 20% OFF - LAST DAY!
Spring Collection coming ??.04.2023
Lose yourself in the BY FAR DAYDREAM world at SSENSE
Buy 1 Print, Get 1 FREE! 🎉

MyStore Clearance Sale On MySlippers
Exciting News! New Courses for the Cleveland Marathon!
Get 20% off on Men's Wedding Bands now! Limited Time Offer.
DOUBLE UP on Your Mask Game
🏋️👉Feeling sore? We can help.
Let’s talk about lenses
New season, new (simplified) skincare routine
- Share on Facebook
- Share on Twitter
- Share via Email
- Share on Linkedin
Business Travel Index
We’ve looked at which airlines offer the best business class service, from lounge facilities and seat comfort, to inflight entertainment..
When traveling for business, it’s essential to have everything available at your fingertips, whether that’s fast wifi, professional facilities, or a wide range of food and drink options.
For those with business connections all over the world, global expense management and AP automation systems are a great way to handle travel expenses and reimbursements internationally.
We’ve taken a look at which airlines offer the best business class service, from lounge facilities and seat comfort, to inflight entertainment. We’ve also looked at which cities are the best to work from, based on factors such as wifi speed and public transport.
By analyzing these factors, we’ve created the ultimate Business Travel Index, helping you choose your options wisely when traveling for business purposes.
Oman Air is the Best Airline for those Traveling Business-Class
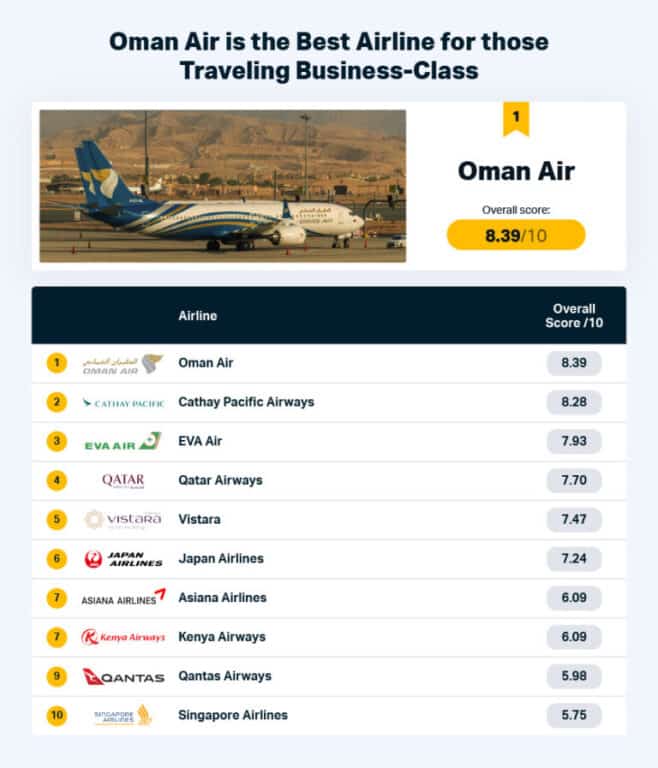
1. Oman Air – 8.39 overall score
Topping the list of best business-class airlines is Oman Air, with an overall score of 8.39. The airline is based at Muscat International Airport and travels to over 50 destinations, including the likes of Saudi Arabia, Qatar, and Egypt.
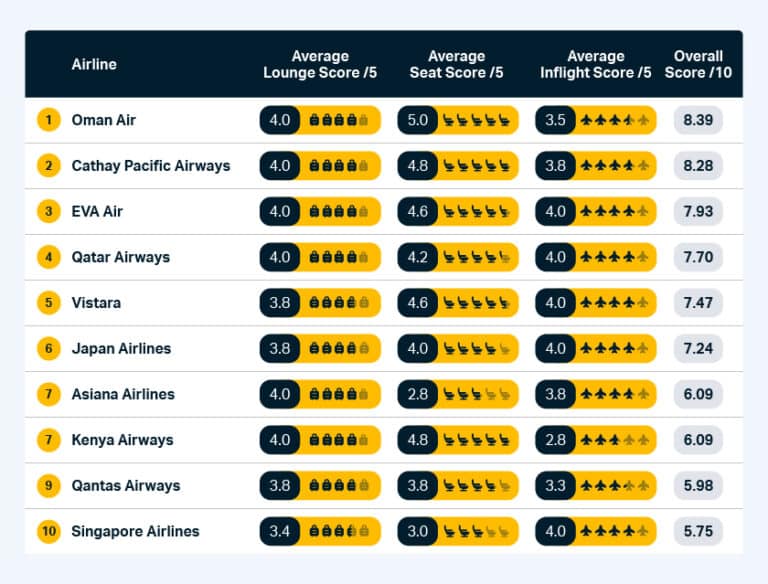
Oman Air scores 5/5 across the board when it comes to its aircraft’s business-class seats, making it the highest-scoring airline in this category. It also receives 4/5 in areas such as staff service (both inflight and in the lounge), inflight entertainment, and lounge catering.
2. Cathay Pacific Airways – 8.28 overall score
Following closely behind is Cathay Pacific Airways, which receives an overall score of 8.28. It is the largest airline in Hong Kong, with its head office located at Hong Kong International Airport. The airline provides flights to over 60 destinations, such as Seoul, Dubai, and Johannesburg.
Cathay Pacific Airways scores 4/5 for the comfort of its seats (both sitting and sleeping), as well as for their width and length, meaning those traveling long haul can rest comfortably. The airline also scores highly for its catering options in lounges, which include The Teahouse in the Pier Business lounge and Noodle Bar in the Wing Business lounge, both located at Hong Kong International Airport.
3. EVA Air – 7.93 overall score
In third place is EVA Air, with an overall score of 7.93. It is one of the two largest airlines in Taiwan and has hubs in both Taoyuan International Airport and Kaohsiung International Airport. The airline flies to 30 different countries, including Thailand, Japan, and China.
EVA Air scores no less than 4/5 across all three categories, receiving 4 for both its lounges and inflight services and 4.6 for its seats. The airline scores 5/5 for the sitting comfort, width, and length of its seats, meaning that anyone choosing to travel with EVA Air is guaranteed to have a comfortable and relaxing experience when traveling long distances.
Oman Air, Qatar Airways, and Turkish Airlines are Amongst the Best Business-Class Lounges
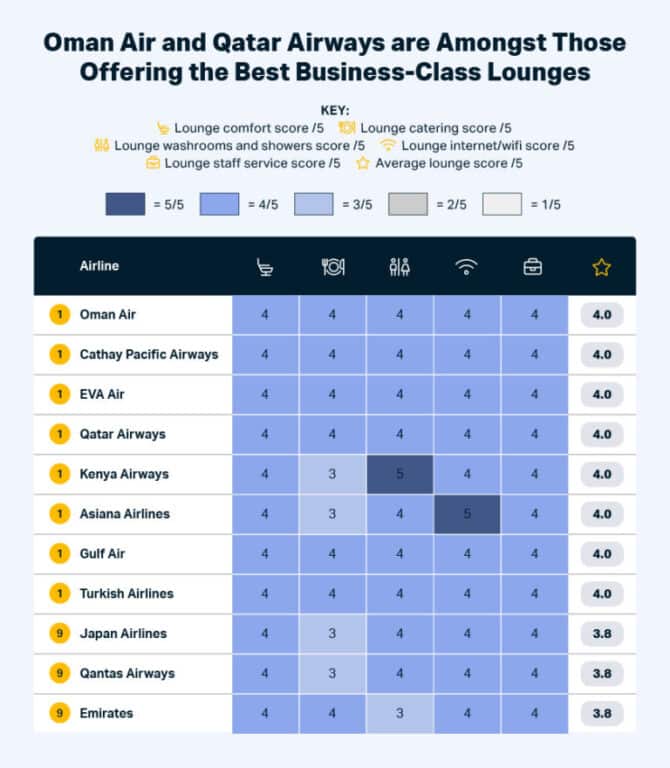
Multiple Airlines – average lounge score of 4/5
There are eight airlines all tying in first place for the best business-class lounge: Oman Air, Cathay Pacific Airways, EVA Air, Qatar Airways, Asiana Airlines, Kenya Airways, Gulf Air, and Turkish Airlines. All eight of these airlines scored 4/5 for their business-class lounges.
Only two airlines scored 5/5 for any part of their business-class lounges: Asiana Airlines for their wifi and Kenya Airways for their washrooms/showers. Before flying with Asiana Airlines to destinations such as Delhi, Tokyo, and Manila, guests can work in the study area of the lounge or relax on one of the full-body massage chairs. For those flying to one of Kenya Airways’ 53 destinations from Jomo Kenyatta International Airport, you can relax in one of the two African landscape-themed business-class lounges.
Oman Air Offers the Most Comfortable Business-Class Seats
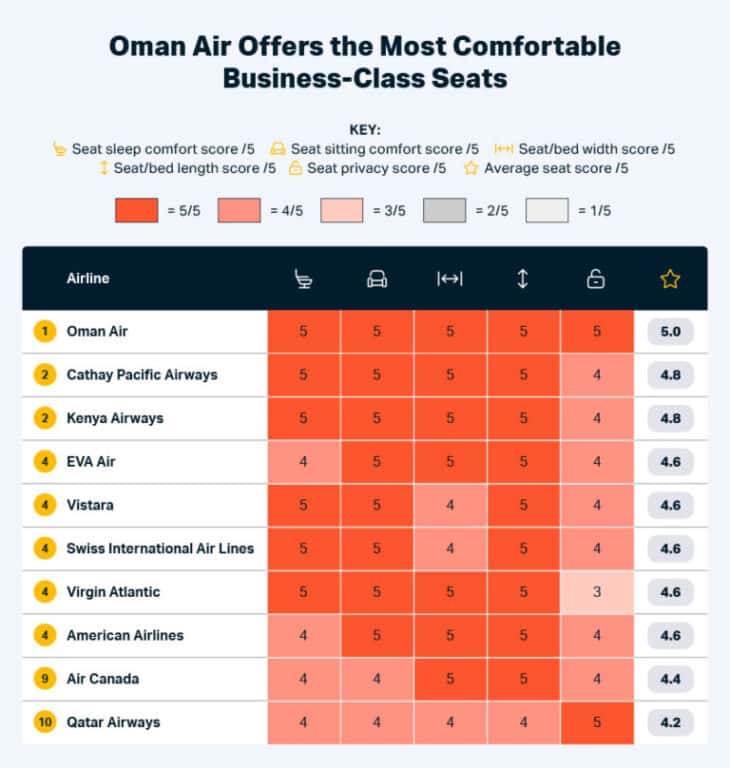
1. Oman Air – average seat score of 5/5
Soaring to the top spot is Oman Air, which received 5/5 across the board for the comfort of its business-class seats. The airline offers an innovative layout in its business class, including direct aisle access, adjustable privacy dividers, and a bed that doesn’t compromise on legroom.
Users of Oman Air have praised the airline for its “very generous (if not lavish)” seats, which they consider to be comfortable and well-maintained. They have also been commended for the width of their business-class seats, which makes it easy for guests to sleep comfortably.
2. Cathay Pacific Airways and Kenya Airways – average seat score of 4.8/5
Following closely behind are Cathay Pacific Airways and Kenya Airways, both receiving an average score of 4.8/5. Cathay Pacific Airways have won awards for their business-class seats, which provide their guests with privacy partitions, one-click sitting and sleep settings, a fully flat bed, and 400-thread-count Bamford bedlinen (on long haul flights only). The extra-wide cabins of their A350 aircraft also feature intelligent lighting and reduced noise, which allows guests to sleep better.
Kenya Airways have been praised for the level of comfort that their seats provide when sleeping. One guest who posted a review on Skytrax said, “The seats seemed wider and longer than the pods as my feet did not touch the end wall, and I did not feel cramped while sleeping on my side.” They also feature power outlets, a reading light, and a moveable dividing screen for privacy.
TEVA Air, Qatar Airways, and Singapore Airlines are Amongst Those Offering the Best Inflight Business-Class Service
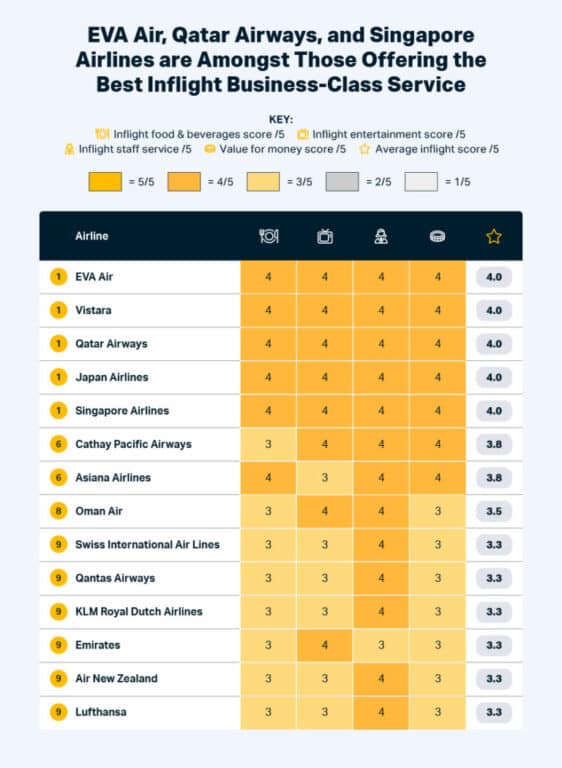
1. EVA Air, Vistara, Qatar Airways, Japan Airlines, and Singapore Airlines – average inflight score of 4/5
The airlines offering the best business-class inflight experience, with an average score of 4/5, are EVA Air, Vistara, Qatar Airways, Japan Airlines, and Singapore Airlines. Those flying with Japan Airlines from both Tokyo airports can enjoy food prepared by top chefs, including Mishina Jun, the Japanese restaurant Ren Mishina, and Namae Shinobu, the French restaurant L’Effervescence.
As well as providing guests with a range of delicious appetizers, main meals, and desserts, Qatar Airways also offers afternoon tea, complete with traditional finger sandwiches, warm scones, and delicate pastries. A cheese board is also available, consisting of a range of cheeses, grapes, dried fruits, and chutneys.
Those flying business class with Vistara start their journey with a refreshing welcome drink before enjoying a delicious 3-course meal of both Indian and International cuisine, served on fine bone china. Passengers can also enjoy a warm cup of Starbucks coffee or choose from a range of soothing teas.
New York is the Best City for Those Traveling for Business Purposes
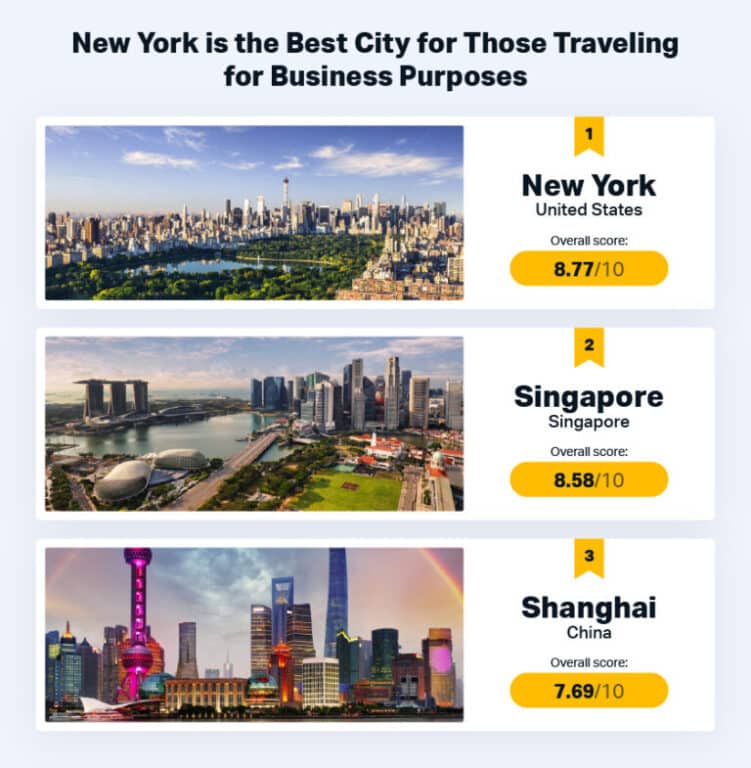
1. New York, United States – 8.77 overall score
Topping the list of business-travel hotspots is the city that never sleeps, New York, which has an overall score of 8.77. The city is a global center for finance, technology, entertainment, and media and is also the home of the United Nations headquarters. As of 2021, the metropolitan area of New York had a gross metropolitan product of over $2.4 trillion, making it the largest metropolitan economy in the world.
New York ranks second for competitiveness, with a score of 67.22. In addition, it also ranks third for the fastest average fixed broadband speed and the number of universities in the top 100, the latter of which it ties with Berlin.
2. Singapore, Singapore – 8.58 overall score
In second place is the city-state of Singapore, with an overall score of 8.58. Singapore attracts a large amount of foreign investment, benefitting from a prime trading location, a highly skilled workforce, low tax rates, advanced infrastructure, and zero tolerance against corruption. In 2019, the city-state was named the world’s most competitive economy, according to the ranking of 141 countries by the World Economic Forum.
Singapore ranks fourth for urban mobility readiness and fifth for competitiveness, achieving a score of 60.53. In addition, the city-state also has two universities that feature in the top 100 ranking by Times Higher Education.
3. Shanghai, China – 7.69 overall score
Coming in third is Shanghai, achieving an overall score of 7.69. The city is a global financial, business, and economic hub, and the Port of Shanghai is the busiest container port in the world. In 2018, it was estimated that the Greater Shanghai metropolitan area produced a gross metropolitan product of almost $1.33 trillion.
Shanghai has the fastest average mobile internet speed of all the analyzed cities, standing at 158.63 Mbps. The city also ranks second for the fastest average fixed broadband speed, sixth for the number of universities in the top 100, and seventh for competitiveness score, which relates to business activity, human capital, cultural experience, and political engagement.
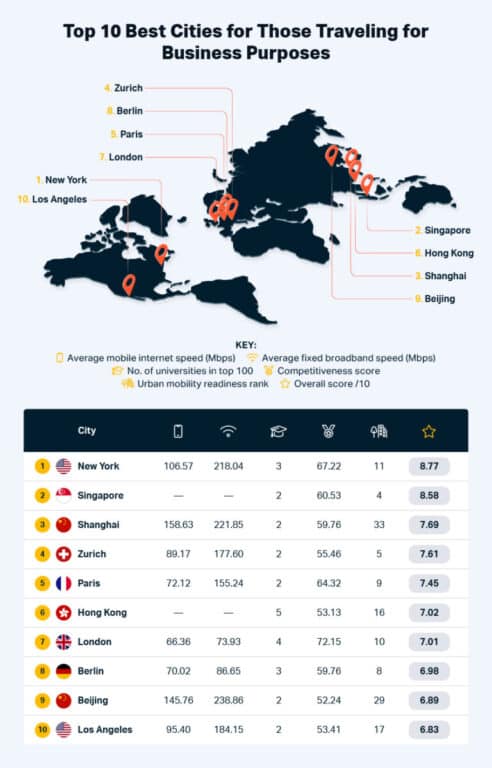
Fastest Average Internet Speeds
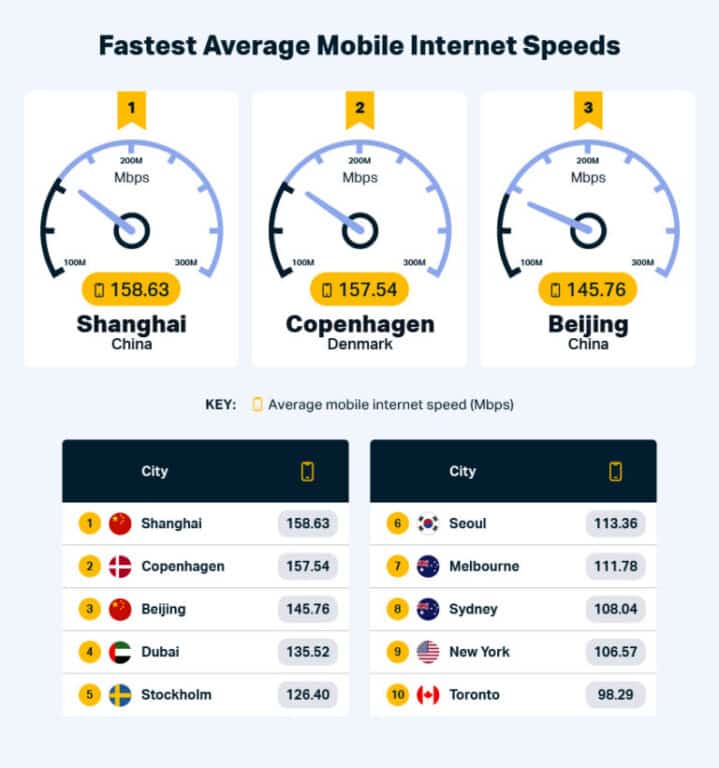
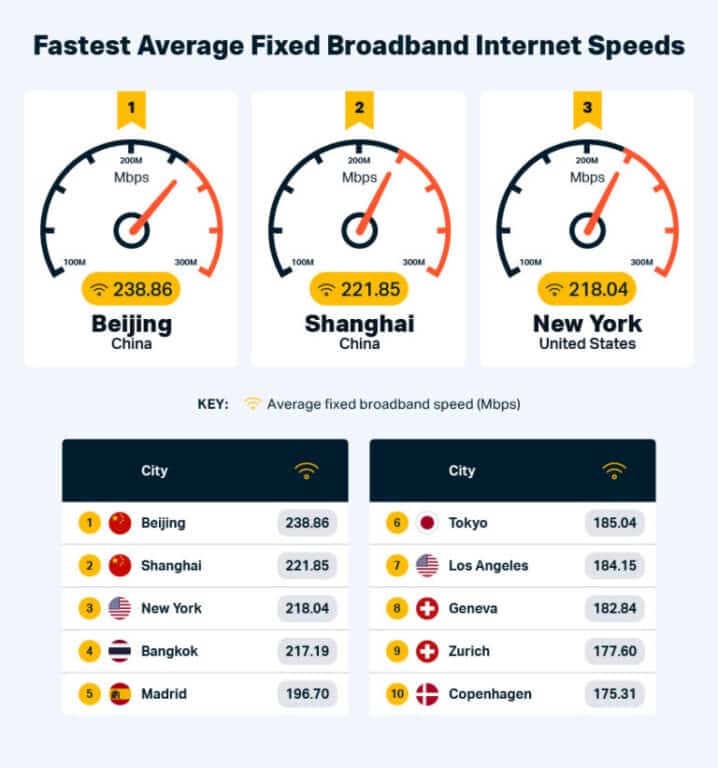
When traveling for business purposes, it’s essential that you can access the Internet and complete your work wherever you are. Therefore, it’s helpful to know which cities in the world will provide you with the best internet access. One of the cities topping the list is Shanghai, which has an average mobile internet speed of 158.63 Mbps. Some of the biggest internet providers in Shanghai and across China include China Mobile, China Unicom, and China Telecom.
Following closely behind is the city of Copenhagen, with an average mobile internet speed of 157.54 Mbps. The city, which is the capital of Denmark, has a range of internet providers, with some of the most popular being Yousee, Hiper, and Telia. However, it seems as though China is the place to be for those needing fast internet, as Beijing places third, with an average mobile internet speed of 145.76 Mbps.
In terms of average fixed broadband speed, Beijing and Shanghai top the list yet again, with average speeds of 238.86 Mbps and 221.85 Mbps, respectively. Placing third is the city of New York, which has an average fixed broadband speed of 218.04 Mbps. Recommended by HighSpeedInternet.com, the top five internet providers within New York are Spectrum, Astound Broadband, T-Mobile Home Internet, Optimum, and Verizon Home Internet.
Hong Kong is the City with the Most Universities in the Top 100
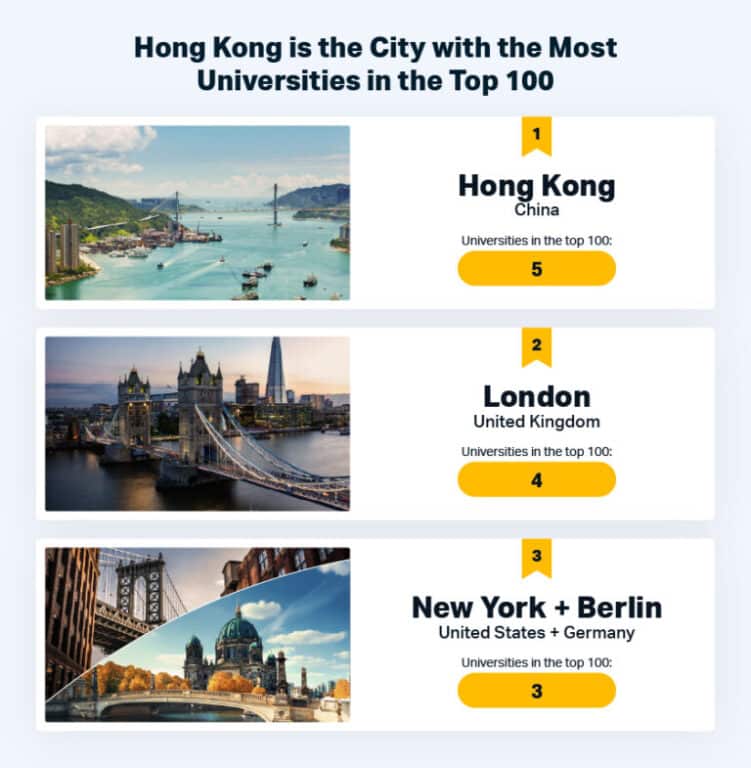
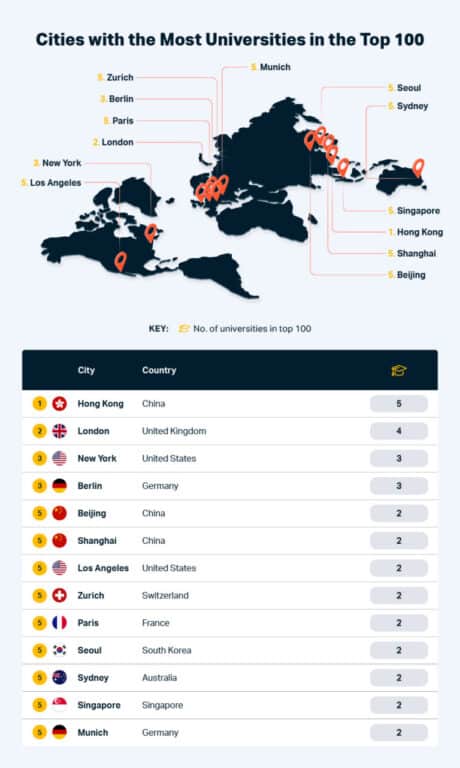
1. Hong Kong, China – 5 Universities in the Top 100
The city with the most educational establishments in the top 100 in Hong Kong. The city has five universities: the University of Hong Kong, the Chinese University of Hong Kong, The Hong Kong University of Science and Technology, the Hong Kong Polytechnic University, and the City University of Hong Kong.
The University of Hong Kong is the oldest post-secondary educational institution in the city and was built in 1911. It is currently ranked 4th in the Times Higher Education Asia University Rankings and 31st in the World University Rankings. The university has over 5,000 international students from over 90 countries and regions, making up 43% of its student body. There are ten academic faculties at the University of Hong Kong, including Architecture, Dentistry, and Medicine.
2. London, United Kingdom – 4 universities in the Top 100
The second-best game for streaming in 2023 is League of Legends, which received an overall score of 9.65 out of 10. Developed by Riot Games and released as far back as 2009, League of Legends has become a behemoth of the gaming world, with a dominant place in streaming as well as in competitive e-sports tournaments.
Part of League of Legends’ popularity can be attributed to accessibility, with the game being free-to-play and the only purchasable items being purely cosmetic, offering no in-game advantage. League of Legends has 36 million followers on Twitch and has an average of approximately 156,000 viewers in 2023, with a peak of just over 914,000.
3. New York, United States, and Berlin, Germany – 3 universities in the Top 100
Tying in third place are the cities of New York and Berlin, both of which have three universities in the top 100 in the World University Rankings: Cornell University, New York University, Columbia University in New York, Charité – Universitätsmedizin Berlin, Humboldt University of Berlin, and the Free University of Berlin.
Columbia University, which was founded in 1754, is the oldest in the state of New York and one of the oldest throughout the whole of the United States. Some famous alumni include former US Presidents Franklin and Theodore Roosevelt and Barack Obama, as well as actors Jake Gyllenhaal and Joseph Gordon-Levitt. The Humboldt University of Berlin was established over 200 years ago in 1810 and has a world-class reputation in the arts and humanities fields. In addition to Albert Einstein spending time at the university as a professor for some time, some famous alumni include Marxism founders Karl Marx and Friedrich Engels, novelist Alfred Döblin, and composer Felix Mendelssohn.
London is the Most Business-Competitive City.
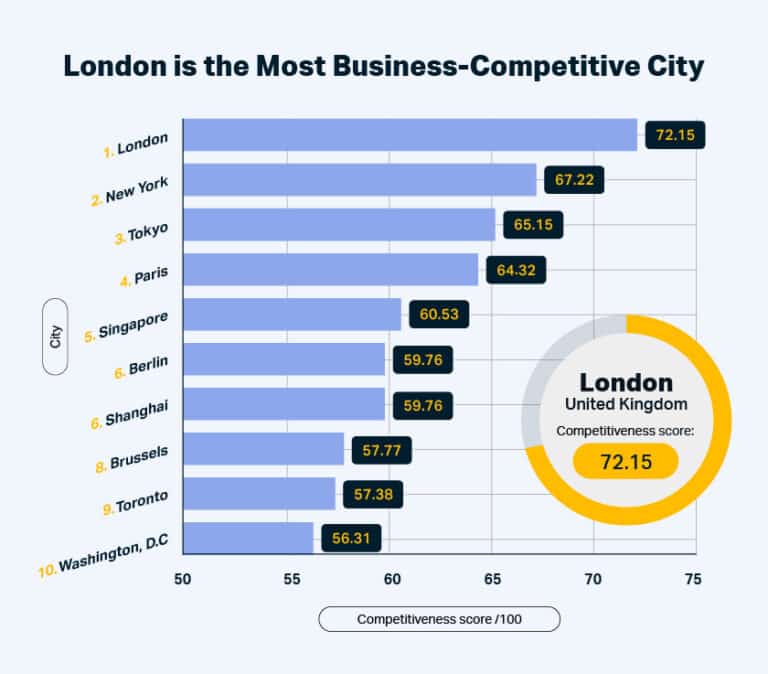
When traveling for business, knowing which cities are the most competitive in business activity, human capital, cultural experience, and political engagement can be handy. The city of London is topping the list with a competitiveness score of 72.15. The city is thought to generate around 20% of the UK’s GDP and is one of the most important financial centers in the world. Over 100 of Europe’s 500 largest companies have headquarters in central London, including Aviva, ITV, and Phoenix Group.
New York is in second place, with a competitiveness score of 67.22. Some of the biggest companies based in the city include American Express, Etsy, and Pfizer. Coming in third is the city of Tokyo, which receives a competitiveness score of 65.15. Mitsubishi, Honda, Sony, SoftBank Group, and Toshiba are some of the largest companies in Tokyo.
San Francisco is the Most Urban Mobility-Ready City
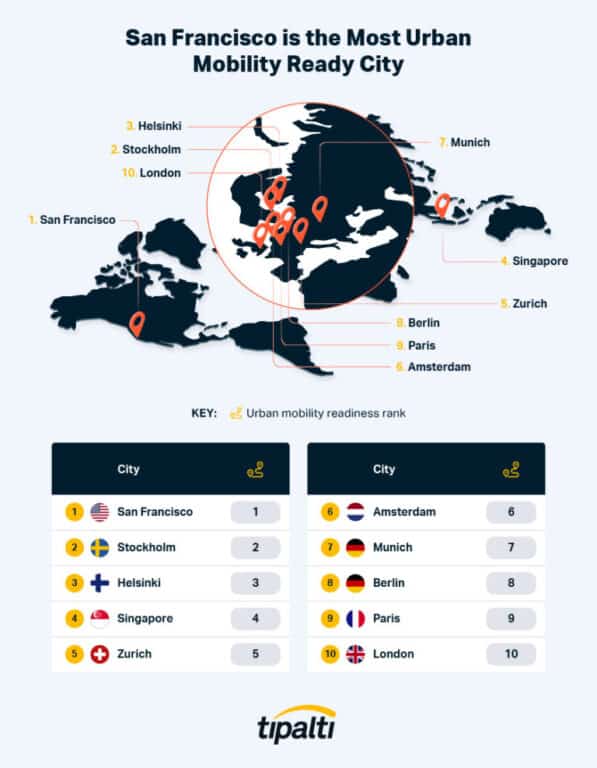
One of the most important things to consider when traveling for business is what public transport is available. The covid-19 pandemic proved that countries and cities must be ready to adapt their mobility networks whenever necessary. San Francisco has been dubbed the most urban mobility-ready city globally, ranking first on the Urban Mobility Readiness Index. San Francisco is well-known for its cable cars, named National Historic Landmark in 1964, attracting almost 6 million riders yearly.
In second place is Stockholm, the capital city of Sweden. There are many ways to get around Stockholm, including subway, bus, tram, ferry, and commuter train. Reflecting the city’s beautiful surroundings, many of Stockholm’s inner city buses run on eco-friendly fuels like ethanol.
Ranking third on the Urban Mobility Readiness Index is the city of Helsinki, the capital of Finland. Many people get around the city via bicycle, using the Baana cycling corridor, a stretch of disused railway line that runs through the city’s center. This year, It was reported that no less than 4,600 city bikes are available to hire in Helsinki.
Methodology
We used sources such as Skytrax and The Points Guy to create a list of airlines that offer a business class service to their customers.
Next, we used Skytrax again to record the scores for each airline for the following lounge-related factors: lounge comfort, lounge catering, lounge washrooms and showers, lounge internet and wifi, and lounge staff service. We then repeated the same process for the following seat-related factors: seat sleep comfort, seat sitting comfort, seat/bed width, seat/bed length, and seat privacy. We also did this for the following inflight factors: inflight food and beverages, inflight entertainment, inflight staff service, and value for money. We then calculated the average lounge, seat, and inflight score. No score was available for the lounge washrooms and showers for Vistara. All data is correct as of May 22, 2023; therefore, the scores may now differ.
We used sources such as Kearney and Mori M Foundation to create a list of global business cities.
Next, we gathered each city’s average mobile internet and fixed broadband speeds. No data was available for Singapore, Hong Kong, Munich, Chicago, Boston, Washington D.C., San Francisco, or Vancouver. All data was collected on May 22, 2023.
We then used Times Higher Education to discover how many ‘top 100’ universities were in each city. All data is correct as of May 22, 2023.
Next, we used CEOWorld Magazine to gather the competitiveness score for each city. This score is defined by business activity, human capital, cultural experience, and political engagement. All data was collected on May 22, 2023.
We then gathered the ranking for each city on the ‘Urban Mobility Readiness Index’ using Oliver Wyman Forum . This score is defined by four key trends: connectivity, public transit, electrification, and automation. No data was available for Copenhagen, Melbourne, Geneva, Brussels, Taipei, Osaka, Tel Aviv, and Vienna. All data was collected as of May 22, 2023.
Finally, we calculated an overall score for the best business-class airlines and global business cities. We did this by giving each factor a normalized score out of 10, before taking our final overall score as an average across all factors.
About the Author
US Travel Header Utility Menu
- Future of Travel Mobility
- Travel Action Network
- Commission on Seamless & Secure Travel
- Travel Works
- Journey to Clean
Header Utility Social Links
- Follow us on FOLLOW US
- Follow us on Twitter
- Follow us on LinkedIn
- Follow us on Instagram
- Follow us on Facebook
User account menu
Travel price index.
MONTHLY INSIGHTS December 20, 2023
The Travel Price Index (TPI) measures the cost of travel away from home in the United States. It is based on the U.S. Department of Labor price data collected for the monthly Consumer Price Index (CPI). The TPI is released monthly and is directly comparable to the CPI.
Please see attached table for the latest data.
Member Price: $0
Non-Member Price: $0 Become a member to access.
Ready to simplify your receipt and expense management process?
Enter your email to sign up for Expensify today!
40+ business travel statistics to know before you book

Whether you're a seasoned business traveler or preparing for your maiden corporate voyage, staying up-to-date with key business travel data is crucial. Making informed decisions based on relevant stats can save you not just time and money but also the occasional travel-induced headache.
To help you stay in the loop, we’ve compiled over 40 business travel statistics, ranging from the average business trip cost to the rise of “bleisure.” Let's dive in and see how they can impact your next business trip.
Statistics on the cost of business travel
Ever wondered what the price tag on a typical business trip looks like? Curious about what could land your expense report in the red? You're about to get a clear look. We've dug into the numbers to bring you the average costs for business trips, both within the U.S. and beyond its borders.
1. The average business trip cost in the U.S. in 2023 was reported to be $1,293 , with the daily cost being $325 . [1]
2. For international trips, the average cost in 2023 was $2,600 per traveler. [1]
3. In comparison, the average cost of a domestic business trip in the U.S. in 2019 was $990 , while international business trips averaged $2,525 , showing us that business travel costs are on the rise. [2]
4. On average, companies spend 17%-27% of their total travel budget on airfare. [3]
5. More than 20% of a business travel budget is allocated toward covering food expenses. [3]
6. Lodging makes up around 34% of the total cost of business travel. [3]
7. While business trips constitute about 12% of total U.S. air travel, they contribute up to 75% of airlines’ profits. [4]
8. The overall budget for business travel in 2023 is expected to reach 98% of the levels seen in 2019 , showing a recovery trend. [5]
Business travel safety stats
As companies globalize and work trickles beyond geographical boundaries, ensuring the safety and security of traveling employees is more important than ever. In this section, we’ll unveil statistics highlighting common safety concerns of global business travelers.
9. 46% of those who travel for work don’t have a corporate travel safety plan . [6]
10. 73.2% of travelers are concerned about delayed flights. [7]
11. Out of a group of European business travelers surveyed in 2018, 53% were impacted by terrorism. [8]
12. 49% of travelers surveyed were impacted by political or social unrest. [8]
13. 28% of travelers surveyed were impacted by tropical diseases. [8]
14. 25% of travelers surveyed were impacted by crime. [8]
15. Only 44% of employees surveyed stated that their employers organized travel risk awareness training. [8]
16. 83% of female business travelers have safety concerns, indicating the need for gender-specific guidance and resources in business travel safety training. [6]
Business travel destinations: facts and figures
Let’s uncover the go-to destinations for business travelers and delve into the spending trends associated with them. We've sifted through the data to bring you some eye-opening stats on the top countries for business travel and the biggest financial cities across the globe.
17. The most visited countries for international tourism, which includes business travel, are France , Spain , and the U.S. [9]
18. The most expensive states for business travel were identified as Hawaii , Massachusetts , and California . [1]
19. New York City was reported as the most expensive city for business travel, with daily costs averaging $799. Geneva was next ( $716 per day ), followed by Zurich ( $661 per day ), Washington D.C. ( $621 per day) , and Paris ( $617 per day ). [10]
20. Italy registered nearly 15 million international business travel arrivals in a recent year. [11]
Breaking down the demographics of business travelers
A diverse group of people travel for work, each with unique characteristics and preferences. This section aims to provide a clearer understanding of today's modern business traveler. Let's peel back the curtain and explore the profiles of those who embark on these journeys.
21. According to the Bureau of Transportation, men make up 77% of those traveling for work. [12]
22. At least 50% of business travelers are between 35-54 years old. [3]
23. 63% of business travelers have a bachelor's degree. [3]
24. The average business traveler takes roughly 6.8 trips per year. This number is higher for millennials, who take an average of 7.4 trips per year. [3]
25. 83% of business travelers see business travel as a positive experience. [12]
26. About 79% of business travelers say that travel improves their overall job satisfaction. [12]
Statistics on business travel sustainability
In the wake of rising environmental awareness, the business travel sector is tuning into sustainability. Companies are curbing air travel, while travelers are becoming more mindful of their carbon footprints. Here’s a glimpse of statistics unveiling how eco-friendliness is reshaping business travel.
27. 55% of companies are cutting down on air travel post-pandemic. [13]
28. 56% of business travelers state that lowering their carbon footprint is a moderate priority, while 21% believe it’s a top priority. [14]
29. Traveling in economy class has half the CO2 footprint of business class, as passengers take up less space. [15]
30. 77% of business travelers stated that they would be willing to forego daily hotel cleanings to reduce their carbon footprint. [14]
31. Nearly half ( 49% ) of companies are developing new climate-friendly products or services, indicating a shift towards sustainability that could include eco-friendly travel solutions and policies. [13]
Data: business travel tech usage
The digital shift is simplifying business travel, making online check-ins, bookings, and post-trip reimbursements a breeze. Below are stats showcasing how tech adoption is refining the business travel experience for travelers and employers alike.
32. 51% of passengers around the world use a smartphone or other device to check in online. [7]
33. 68% of business travelers book their trips through online channels, according to a survey of 1,000+ people in 2018. [16]
34. 57% of business travelers want to have a single application to manage their planning, booking, and reimbursement needs. [7]
35. Only 26% of travel managers claim that their corporate travel booking tool does a good job of accommodating employees with accessibility needs. [14]
36. 37% of travel managers aren’t sure how well their company’s booking tool assists employees with accessibility needs. [14]
The ins and outs of bleisure
"Bleisure" travel — a fusion of business and leisure trips — has been gathering steam in recent years. As the lines between work and leisure blur, especially with the rise of remote work, many are seizing the opportunity to blend business trips with leisure activities. Let’s take a look at what the numbers are saying about bleisure:
37. U.S. business travelers take over 405 million long-haul business trips annually. It is estimated that employees are adding vacation time to around 60% of these trips (243 million). [17]
38. 67% of bleisure trips begin with an agenda to attend a conference, 46% with external meetings, and 42% with sales opportunities. [17]
39. 57% of companies have a policy in place for employees aged 20-30 to extend business trips with vacation time. [18]
40. 17% of bleisure trips stretch over four nights, 31% span three nights, and 39% last for two nights. [17]
41. 35% of bleisure travelers have company during their trips, while 36% plan to visit with family or friends at their destination. [17]
42. 86% of bleisure travelers regard corporate travel as a vital component for career development. [19]
43. 39% of bleisure travelers actively seek job roles that offer business trip opportunities — they’re even open to sacrificing other benefits for more chances to travel. [19]
44. Bleisure trips are linked to efforts to become more sustainable, with 60% of surveyed business travelers reporting that the pandemic has made them more conscious of the environmental impact of traveling. [20]
Enhance your experience: business travel tips
Traveling for business — especially for bleisure — is always exciting. However, the administrative trail of expenses left in the wake of your adventure can often dull the sparkle, especially when it takes ages to get paid back after your business trip.
Let’s break down some tried-and-true business travel tips to ensure your next trip isn’t just fruitful but also enjoyable.
Leverage expense management software: Utilizing expense management software like Expensify is a game-changer for seamless business travel. It automates expense tracking, categorization, and reporting, so you can say goodbye to manual data entry and hello to more free time to explore new cities.
Ditch paper receipts: Paper receipts are easy to lose and a hassle to manage. Thanks to Expensify’s SmartScan technology, you can easily track spend on the road by simply snapping a picture of your receipt, uploading it to Expensify, and carrying on with your day.
Stay connected: Staying connected is key, especially when traveling internationally. Make sure to purchase an international SIM card or a global roaming plan to have a reliable mobile connection to keep in touch with your team and manage work on the go.
Prioritize your well-being: Traveling can disrupt your routine, but it's essential to maintain a healthy lifestyle. Ensure you have a balanced diet, stay hydrated, stick to your exercise routine, and get enough rest to stay productive and enjoy your trip!
Jet-set with confidence: Expensify’s got your back
Armed with these insightful business travel statistics, you're in a great spot to make savvy travel decisions that could lead to significant savings. And with Expensify in your back pocket, you have everything you need to streamline expense tracking and stay on top of your finances while traveling.
With the administrative hassle curtailed, all that's left is for you to pack your bags and jet off on your next business adventure with an air of confidence and ease. Safe travels!
Struggling with receipt tracking on business trips?
Expensify automates receipt scanning, simplifies reports, and gives you real-time insights — even on the move.
Expensify values your privacy. We’ll never sell your personal information to others.

The Average Business Trip Costs $1,293 and Prices Will Increase in 2020, Business Wire
Business Travel Costs Around the World, Expert Market
25+ Essential Business Travel Statistics [2023]: How Much Do Companies Spend on Business Travel, Zippia
How Much Airline Revenue Comes From Business Travelers? Investopedia
2023 Outlook: Business Bounces Back, Morgan Stanley
20 Business Travel Safety Tips and Guidelines for Employees, Alert Media
105 Critical Business Travel Statistics: 2023 Spending & Concerns Analysis, Finances Online
2018 Business Impact of Travel Risks Survey, International SOS
International Travel Statistics: Facts and Trends for 2023, The Broke Backpacker
Hong Kong remains the most expensive location in Asia for business travel, ECA International
Number of international business tourist arrivals in selected countries worldwide in 2019, Statista
25 Impressive Business Travelers Stats 2023 [Facts & Trends], Thrive My Way
Deloitte 2022 CxO Sustainability Report, Deloitte
100+ Business Travel Statistics (2023), Dream Big, Travel Far
Flying and Driving: Can we Travel more Sustainably? ClimateScience
Essential Digital Transformation In Travel Industry Statistics In 2023, Zipdo
77+ Bleisure Travel Statistics, Stratos
How Millennials Are Creatively Approaching Their Business Travel, Forbes
42 bleisure travel statistics for 2023, TravelPerk
The Future of Blended Travel, Crowne Plaza

Lindsey Peckham
A native Bostonian (with a 3-year stint in San Francisco in between), Lindsey now calls London home. She still prefers iced coffee over tea, but has a new soft spot for a Sunday roast. When she’s not working on marketing at Expensify, you’ll most likely catch her spending too much money at the local flower market.
Related Posts

Automation for small business: streamlining success

Six benefits of outsourcing accounting for small businesses in 2024

Spend control 101: Everything a small business owner needs to know
Better money management = more money to manage..
Get started with Expensify.

- Expense Management
- Spend Management
- Expense Reports
- Company Card
- Receipt Scanning App
- ExpensifyApproved!
- ExpensifyHelp
- Expensify App
- About Expensify
- Expensify.org
- Investor Relations
Get Started
- Create a new account
©2008-2023 Expensify, Inc.
The Expensify Visa® Commercial Card is issued by The Bancorp Bank, N.A. pursuant to a license from Visa U.S.A. Inc. and may not be used at all merchants that accept Visa cards. Apple® and the Apple logo® are trademarks of Apple Inc., registered in the U.S. and other countries. App Store is a service mark of Apple Inc. Google Play and the Google Play logo are trademarks of Google LLC.
Money transmission is provided by Expensify Payments LLC (NMLS ID:2017010) pursuant to its licenses .
Savings Calculator
How much does business travel cost your company? Is it really cheaper to book on the internet? Let's crunch those numbers. Get an instant result on how much you could save on money and time.
You're only five quick questions away from two percentages that'll drive your cost saving goals forward.
These results are based on data from our current customers & our expert travel consultants. With 30 years of experience in finding, booking, and reporting on the best travel deals, we know a thing or two about saving time and money.
Answer these 5 short questions to find out how we can help you get more from your travel budget, how many international economy flights do you book a week (average), …and what about international premium and business class flights (average), moving to hotels, how many room nights do you book a week (average), last number, how many car transfers/private cars do you book a week, final question – can you quickly pull data and reports to see all your company’s travel expenses and travel patterns.

Time saved per year
Imagine what else you could be doing with that time!
Money saved per year
Imagine what else you could be doing with that money!
Start saving on business travel today!

IMAGES
VIDEO
COMMENTS
Meal Prices: BTN rebuilt its meal and restaurant database in 2023. BTN will update meal data annually, using the following methodology. U.S. Meal Data: Cities with annual GDP above $95 billion: BTN surveyed six independent restaurants and three hotel restaurants for breakfast; six chain and six independent restaurants for each lunch and dinner ...
Corporate Travel Index + Calculator Co-Sponsorship Deliverables: $45,000 net. Company logo included as a co-sponsor in a static leaderboard ad unit at the top of the landing page. Ad unit to be built by BTN. Half page ad unit included on index landing page. Ad unit to be provided by sponsor.
2014: Economic Recovery in Europe, Travel Costs Rising in Asia/Pacific, Mild Increases in U.S. & Americas Stays Flat. BTN and its research partners dove into per-diem data for 100 U.S. cities and 100 more around the rest of the world. The result: daily costs for hotel, car rental and food to help manage your travel program.
For your convenience, we have provided a link to the Corporate Travel Index Calculator, which allows you to search by city, hotel tier, car rental class and meals for the United States as well as non U.S. major cities. Key Points for your Attention. Covid-19 and its related variants will not exit the corporate travel stage in 2022.
Access the Corporate Travel Index Calculator via the button below to calculate total daily trip costs for your chosen destinations and discover quarter-on-quarter changes. Zurich emerged as the most expensive destination for business trips in our most recent update and for each quarter last year, while Milan usurped Paris as the second ...
BTN's 2024 Corporate Travel Index is the business travel industry's definitive resource for business travel costs in 200 cities around the world. ... Hotel, car rental and safety data are updated quarterly in BTN's Corporate Travel Index Calculator, where users can customize per diem snapshots based on the class of service allowed by ...
U.S. PER DIEMS RANKED www.businesstravelnews.com Rank Among 100 US Cities City Risk Score Avg Hotel Cost Across Selected Tiers Avg Car Rental Cost
BTN's corporate travel index is calculated based on the following factors: average room rate, car rental/taxi rates, restaurant meal prices, and risk level. In 2022, BTN introduced a new ranking that includes an analysis of daily business travel expenses in 200+ cities around the world.
Furnished Apt. Co. Blueground Leans into Corp. Market. Flight Centre Ready to Invest in More Innovation
Provided by Business Travel News . Hotel, car rental and safety data are updated quarterly in BTN's Corporate Travel Index Calculator, where users can customize per diem snapshots based on the class of service allowed by their travel policies for hotel and car rental categories. Meal costs and taxi rates are updated annually. Five years of data are now available in the calculator, allowing ...
Stepping It Up: Small & midsized travel programmes; Diversity, Equity & Inclusion in business travel; Business Travel Rebooted; New Horizons: The 2022 sourcing guide; Wheels in Motion; EVENTS. Webinars; Business Travel Show Europe; Business Travel Show Europe Kick Off; Business Travel Awards Europe; Business Travel Intelligence Summit Europe
RISK SCORE KEY: 1-20 extremely safe; 21-40 very safe; www.businesstravelnews.com 41-60 safe; 61-80 less safe, more risky; 81-100 very dangerous U.S. NON-U.S. Rank Among 100 US Cities City Total Daily Cost Risk Score 100 Akron, OH $230.57 36 65 Albany, NY $279.84 33 70 Albuquerque, NM $275.56 38 57 Allentown, PA $289.53 35 63 Anaheim, CA $285.32 32 53 Atlanta, GA $296.11 39
RISK SCORE KEY: 1-20 extremely safe; 21-40 very safe; www.businesstravelnews.com 41-60 safe; 61-80 less safe, more risky; 81-100 very dangerous U.S. NON-U.S. Rank Among 100 US Cities City Total Per Diem Risk Score 96 Akron, OH $287.63 34 56 Albany, NY $327.50 36 87 Albuquerque, NM $303.28 41 78 Allentown, PA $307.27 32 31 Anaheim, CA 364.96* 32 35 Atlanta, GA $349.60 38
WHAT'S THE CORPORATE TRAVEL INDEX CALCULATOR? BTN indexes 200 cities every quarter to show booked business travel rates compiled from BTN's travel management company and managed travel data specialist partners. These aren't consumer rates or bottom-basement wholesale rates. The Index is compiled from actual business travel bookings made ...
Oman Air is the Best Airline for those Traveling Business-Class. 1. Oman Air - 8.39 overall score. Topping the list of best business-class airlines is Oman Air, with an overall score of 8.39. The airline is based at Muscat International Airport and travels to over 50 destinations, including the likes of Saudi Arabia, Qatar, and Egypt.
serving the corporate travel market. 2023 Corporate Travel Index Have you experienced the Corporate Travel Index Calculator? BTN's business travel per diem benchmarking tool calculates per diem costs in 100 U.S. and 100 non-U.S. cities. Now, our online index tool offers more detail and customizable variables
Research: Developed by the U.S. Travel Association, the Travel Price Index (TPI) measures the one-month change in the cost of travel ("travel inflation") away from home in the United States on a seasonally adjusted basis and the 12-month change of the cost of travel away from home in the U.S. on a seasonally unadjusted basis. The TPI is released monthly and is directly comparable to the CPI.
3. In comparison, the average cost of a domestic business trip in the U.S. in 2019 was $990, while international business trips averaged $2,525 , showing us that business travel costs are on the rise. [2] 4. On average, companies spend 17%-27% of their total travel budget on airfare. [3] 5.
Get an instant result on how much you could save on money and time. You're only five quick questions away from two percentages that'll drive your cost saving goals forward. These results are based on data from our current customers & our expert travel consultants. With 30 years of experience in finding, booking, and reporting on the best travel ...